Photoelasticity Analysis with Python

Definition
Photoelasticity is a technique that uses a polarized light beam on the surface of a birefringent material subjected to a certain mechanical stress to obtain isoclinic fringes. These fringes are correlated with the stress in question, which allows the determination of critical stress points in a material or specimen.

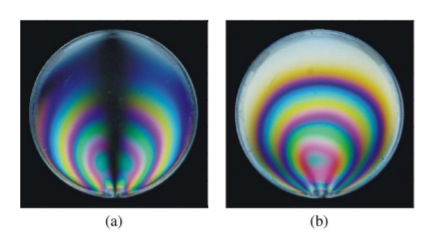
Isoclinic fringes generated by photoelasticity method a) 0° , b) 90°
Electromagnetic waves incident on anisotropic materials can be divided into two components, due to birefringence and a certain pressure, one of these components is out of phase in time, so that at the output of a certain width of the material, a wave superposition is generated , which generates these colored fringes. Determining the critical points in a material and its load concentrations is important since it makes it possible to improve and generate design alternatives for elements.

Components of our wave divided throug a birrefrigent material
How can we generate this phenomenom? (Test prototype)
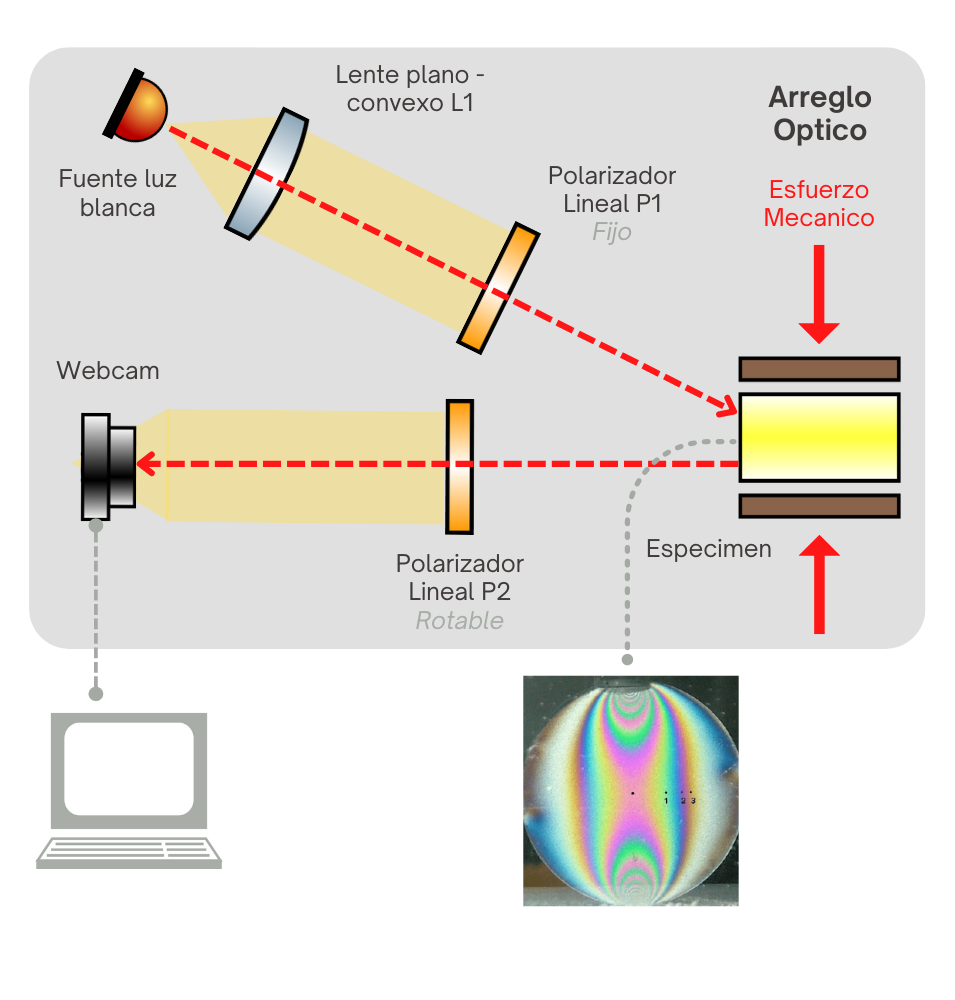
Consists in a polarized white light source incident on a plano-convex lens (L1), this in order to generate a plane wavefront, then a linear polarizer fixed at 90° (P1) is used in order to irradiate the specimen with a polarized wave, once generating the interaction with the material, it is analyzed with a rotatable linear polarizer (P2), the angle that generates the most predominant fringes is sought in order to capture them with the detector (Webcam) and start with the digital processing and analysis.

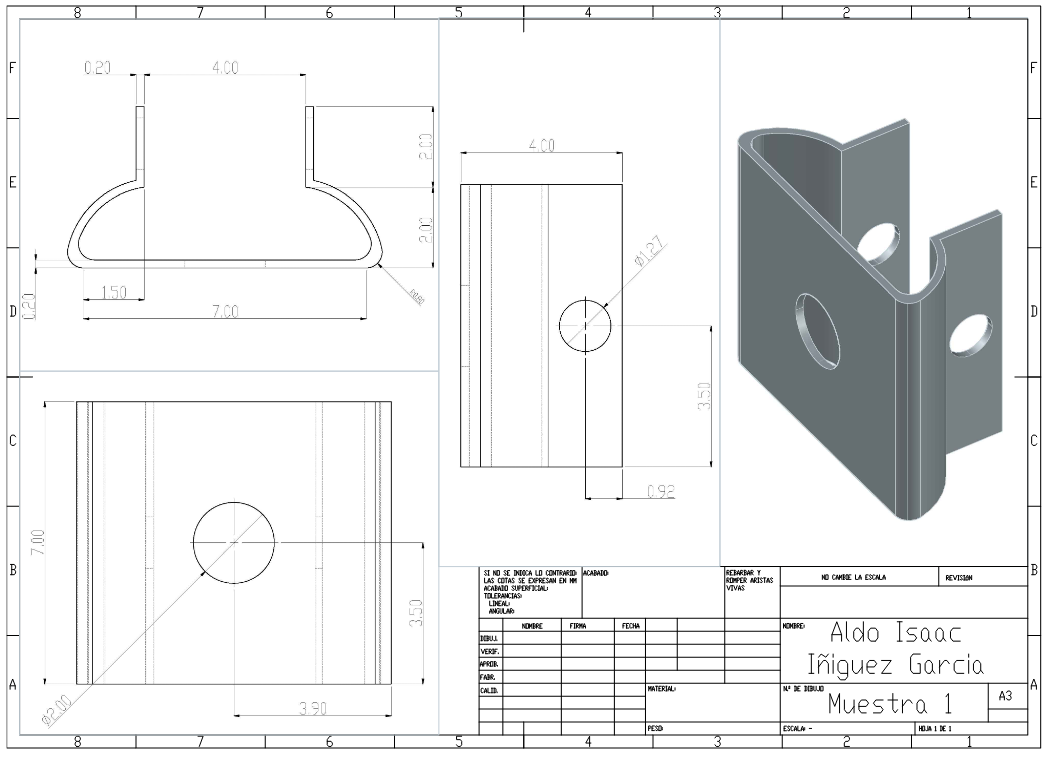
Specimen
We can simulate a test element with any epoxi resin (Resin is a birrefrigent material with the anisotropic behavior we search for), in this case allocate a thickness of 5mm to 8 mm of resin in our specimen, generate a mechanical presion and start analysing with our test base.

Image Processing
Once we generated our isoclinic fringes, then magic comes with OpenCV and PyQt5 libraries
First we need a function in charge to process input from a webcam:
def run(self):
  print("Camara activada")
  #
  self.ThreadActive = True
  Capture = cv2.VideoCapture(0,cv2.CAP_DSHOW)
  Capture.set(3, 780)
  Capture.set(4, 440)

  while self.ThreadActive:
    ret, frame = Capture.read()

    if ret:
      Image = cv2.cvtColor(frame, cv2.COLOR_BGR2RGB)
      L,U = self.update_umbral()
      FlippedImage,cX,cY = ProcesarBordes(frame,L,U)

      ConvertToQtFormat = QImage(FlippedImage.data, FlippedImage.shape[1], FlippedImage.shape[0], QImage.Format_RGB888)
      Pic = ConvertToQtFormat.scaled(780, 440, Qt.KeepAspectRatio)

      ConvertToQtFormat = QImage(Image.data, Image.shape[1], Image.shape[0], QImage.Format_RGB888)
      new = ConvertToQtFormat.scaled(468, 264, Qt.KeepAspectRatio)

      self.ImageUpdate.emit(Pic)
      self.ImageColor.emit(new)
      graficar_cross(Image,cX,cY,self.canvas1,self.ax,self.fig,"Camara")
      histogram(frame,self.canvas2,self.ax2)
  Capture.release()
As you can see we employ QtSignals, this because we want to show output in an user interface, QtSignals help us to achieve this objetive.
Next we need to find what is exactly the center o mass of the greatest area of our isoclinics franges:
def ProcesarBordes(img,lower_color,upper_color):#, lower_color, upper_color): # Esta funcion procesa los bordes de un color definido ademas de calcular el centro de masa y agregar un cursor
    # Procesar Bordes
    img_gray = cv2.cvtColor(img,cv2.COLOR_BGR2GRAY)
    hsv = cv2.cvtColor(img, cv2.COLOR_BGR2HSV)
    blurred_frame = cv2.GaussianBlur(hsv, (15, 15), 0)

    mask = cv2.inRange(img, lower_color, upper_color)
    ret, thresh = cv2.threshold(img_gray, 127, 255, cv2.THRESH_BINARY)

    contours, hierarchy = cv2.findContours(mask, mode=cv2.RETR_TREE, method=cv2.CHAIN_APPROX_NONE) #image=thresh
    image_temp = cv2.cvtColor(mask,cv2.COLOR_BGR2RGB)

    #image_contours = cv2.cvtColor(img_gray,cv2.COLOR_BGR2RGB)#gray
    image_contours = cv2.cvtColor(img,cv2.COLOR_BGR2RGB)#rgb
    cX = 0
    cY = 0
    count = 1
    for cnt in contours:
        area = cv2.contourArea(cnt)

        if area>area_pb: # este 5000 adherirlo al UI
            cv2.drawContours(image=image_contours, contours=contours, contourIdx=-1, color=(255, 0, 0), thickness=1, lineType=cv2.LINE_4)
            peri = cv2.arcLength(cnt,True)
            #approx= cv2.approxPolyDP(cnt,0.02*peri,True) #marca varios cross
            approx = max(contours, key = cv2.contourArea) #marca el predominante
            x,y,w,h = cv2.boundingRect(approx)
            cX = x+int(w/2)
            cY = y+int(h/2)
            cv2.circle(image_contours, (cX, cY), 5, (255, 0, 255), -1)
            cv2.putText(image_contours, "P"+str(count), (cX + 20, cY + 20),cv2.FONT_HERSHEY_SIMPLEX, 0.5, (255, 0, 255), 1)
            cv2.line(image_contours,(0,cY),(img.shape[1],cY),(255,127,0), 1)
            cv2.line(image_contours,(cX,0),(cX,img.shape[0]),(255,127,0), 1)
            count+=1

    finalmask = cv2.cvtColor(mask,cv2.COLOR_GRAY2BGR)

    return(image_contours,cX,cY)
You can see the entire project(Logic and UI) on my github repository, please feel free to leave comments!!
These will perform all sort of analysis if you have your own test base and specimens.

Thanks you for read, any further questions reach me out on my social media!!